Housing Census 2021: Homeownership levels across Preston, Chorley and South Ribble highlight inequalities
and live on Freeview channel 276
Back in January, the government released two sets of data from the housing section of the 2021 Census, with one being the geographical overview on tenure (whether a building is owned or rented).
The Post made comparisons between the situation in Preston, Chorley and South Ribble, but now that the complete data set on household tenure from the 2021 Census are out, we have been able to look more closely into what the different levels of homeownership mean, including how factors such as ethnicity and religion play a part…
Advertisement
Hide AdAdvertisement
Hide AdTenure disparities geographically


The statistics reveal that less people in Preston own their own home compared to the North West and England averages, whilst more own their home in Chorley and even more do in South Ribble.
In Preston, 59.2 per cent own their home outright or with a mortgage/loan/shared partnership, 18.4 per cent are in social renting and 22.4 per cent privately rent or rent for free.
Homeownership is greater in both Chorley and South Ribble, where 72.8 per cent and 76.8 per cent respectively own their home outright or with a mortgage/loan/shared partnership.
Meanwhile 13.2 per cent of people in Chorley are in social renting and 13.9 per cent privately rent/rent for free, and in South Ribble, 10.4 per cent of are in social renting and 12.8 per cent privately rent/rent for free.
Advertisement
Hide AdAdvertisement
Hide Ad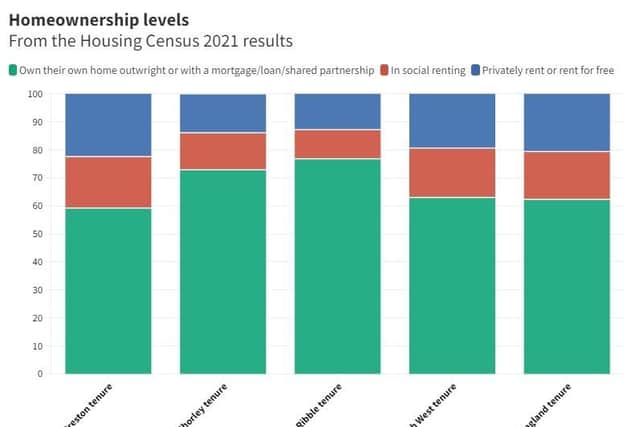
In the North West 63% own their home outright or with a mortgage/loan/shared partnership, 17.6 per cent are in social renting and 19.4 per cent privately rent/rent for free, whilst in England, the figures are 62.3 per cent, 17.1 per cent and 20.6 per cent respectively.
Overall looking at security of tenure in terms of the proportion of tenants versus owner-occupiers, Preston has a lower security, whilst Chorley and South Ribble have higher security, compared to the North West and England averages.
Significance of tenure figures
Housing charity Shelter warned that these Census figures reveal that the country’s chronic shortage of genuinely affordable homes is forcing households into an unaffordable and unfit private rented sector.

Polly Neate, Chief Executive of Shelter, said: “Predictably the number of private rented households in England has skyrocketed since 2011. Despite this, regulation of the sector stagnates. Every day our emergency helpline hears from private renters paying through the nose for damp, mouldy homes, and families too scared to complain for fear they’ll be kicked out.
Advertisement
Hide AdAdvertisement
Hide Ad“To make sure private renting is fit for purpose, the government must keep its promise of introducing a Renters’ Reform Bill this year that will scrap ‘no fault’ evictions and bring in a national landlord register.
“Meanwhile more than a million households are stuck on social housing waiting lists across England, yet each year the government’s failure to prioritise housing means we’re losing more social housing through sales and demolition than we build.
“The only lasting solution to our housing emergency is building more social homes. It’s time for the government to invest in a new generation of good quality social homes with genuinely affordable rents pegged to local incomes.”
Tenure by ethnicity
The newly released data reveals the racial composition of households across the country, with the ‘White’ ethnic group being the most common across all areas – Preston, Chorley, South Ribble, the North West and England – whilst the ‘Asian’ ethnic group and households with a combination of two or more ethnic groups were the next most common.
Advertisement
Hide AdAdvertisement
Hide AdPreston, however, was more ethnically diverse than the national and North West averages, with 77.2 per cent of households being white, compared to 82.9 per cent and 88.7 per cent respectively.
Chorley and South Ribble on the other hand were both less ethnically diverse than the national and North West averages, with 95.4 per cent and 95 per cent of households being white respectively.
In terms of homeownership, although white households were the most common in Preston, Chorley and South Ribble, the ‘White’ ethnic group was not the group most likely to own a home in any of these areas: instead it was those with three or more ethnic groups in Chorley and South Ribble, and Asian households in Preston.
Most notably, households who are of a ‘Mixed’ ethnic group, from the 'Other' ethnic group (which the census names as Arabs and other ethnicities) and from the ‘Black’ ethnic group are across all the areas – Preston, Chorley, South Ribble, North West and England – less likely to own homes.
Advertisement
Hide AdAdvertisement
Hide Ad
The significance
The Post asked the national charity Race Equality Foundation what these figures meant in terms of a wider societal picture.
A spokesperson said “Racial inequality in housing in England has been with us for some time, but seems even more shocking by this new data. Black people are nearly three times more likely to live in social housing compared to their white counterparts. This alarming situation reflects a larger crisis as soaring house prices and a challenging economic climate, worsened by the pandemic, make homeownership increasingly unattainable for many. Rising house prices, slow wage growth, and stringent affordability criteria have made it difficult for those in precarious employment to climb the property ladder.
"Inherited wealth perpetuates racial inequalities in the housing market too. Black people hold less than one eighth of the wealth held by white British people. This lack of financial security deepens existing racial gaps and limits opportunities for minority communities to own property. There is also the impact of racial and class divisions hindering access to high-paying jobs for Black families, further impeding their ability to secure property.
"A continued failure to address systemic issues in the home owning process only exacerbates the existing racial wealth gap. The current housing system creates a two-tiered structure, with expensive homeownership and a precarious rental sector that disproportionately affects Black, Bangladeshi, mixed race, Arab, Roma, and traveller households.
Advertisement
Hide AdAdvertisement
Hide Ad"To be rid of these deep-rooted inequalities, we need policymakers to commit to comprehensive, long-term plans to increase social housing availability, and protect individuals from substandard, unaffordable, and overcrowded living conditions. Urgent action is needed to combat the injustices of our housing landscape and make life fairer and more equitable for all.”

Tenure by religion
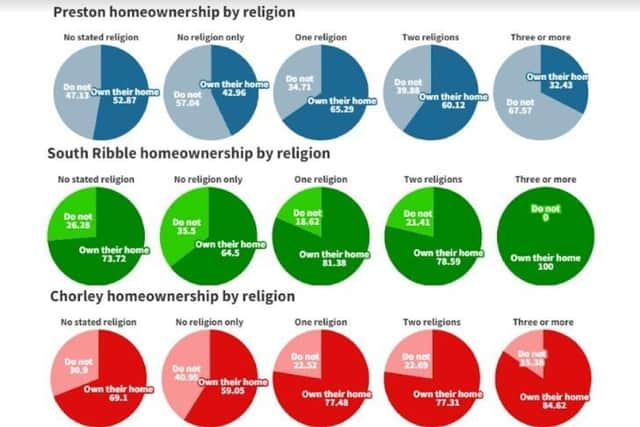
The more recently released data also revealed how many religions each household identified with, and in all five areas, it was most likely that only one religion was named for a household, whilst the next most common answer was to have no religion.
Although, there was not much difference between homeownership levels across the faiths, one consistent pattern was that those who cited 'no religion' were the least likely group to own a house across Preston, Chorley, South Ribble and the North West (in England, it was those with more than three religions, then the non-religious households.)
Why might religion play a part?
Carl Morris, a lecturer in Religion, Culture and Society at the University of Central Lancashire (UCLan), explained: “In relation to homeownership, some of the results can be explained by the way in which religious identity overlaps with social class and age. Christian and Jewish households in Britain tend to be more middle class than other groups – including those with no religion – and they help to boost the rates of home ownership amongst those who have a religious identity. This is coupled with the age factor: younger people are much more likely to identify as having no religion, and they are also much less likely to be homeowners.”
Advertisement
Hide AdAdvertisement
Hide AdTenure by multigenerational homes
Another topic which the housing census looked at was how many multigenerational homes an area had, which are those households where people from across more than two generations of the same family live together.
Preston was found to have more multigenerational households than the national and North West average, whilst South Ribble and Chorley have less: 2.2 per cent of homes across England and the North West are multigenerational compared to 2.5 per cent in Preston, 1.6 per cent in Chorley and 1.7 per cent in South Ribble.
In terms of homeownership, however, whether a household was multigenerational or not made little difference to the likelihood they would own their home: with 69.9 per cent of multigenerational households owning their home vs 66.8 per cent of households who were not.
What are the significance of these figures?
UCLan’s Carl Morris believes the differing prevalence of multigenerational households is likely due to religion but the fact that homeownership levels are similar either way, may be an indicator of another pattern – that the differences between faiths are changing.
Advertisement
Hide AdAdvertisement
Hide AdCarl said: “Muslims in Britain have historically been far more likely to live in extended households. This can partly explain why, for example, Preston has a higher number of multigenerational households. Interestingly though, the trend from the 2001 census is consistently towards these differences between faith groups disappearing. There has been a large rise in the number of single households amongst Muslims – partly because young Muslim graduates are moving to the suburbs and feel less inclined to replicate the living arrangements of their parents and grandparents. More and more, this group is coming to resemble the wider British population across every social marker, including household size.”