Preston is named one of the worst places for traffic congestion in the UK
and live on Freeview channel 276
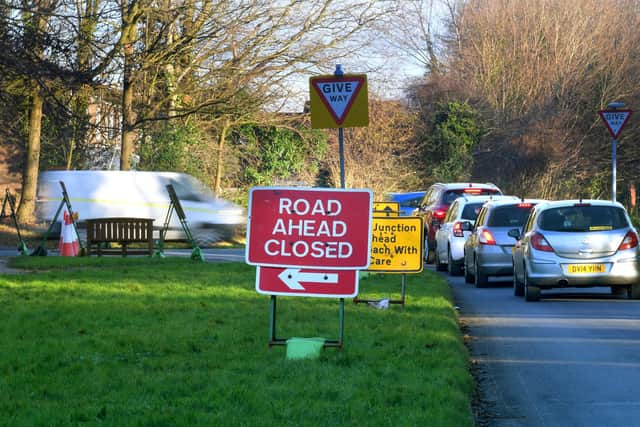
Latest data shows that Preston is one of the worst places in the UK for traffic congestion.
Motoring experts at Moneybarn analysed the average number of hours lost to congestion per year, the average resulting emissions and wasted fuel, as well as which cities enforce low-emission zones to discover which cities in the UK are the most congested.
Advertisement
Hide AdAdvertisement
Hide AdWhat did they say about Preston? Overall, Preston came out as sixth worst, but commuters in the city wasted the most fuel and produced the most additional CO2 in the country, due to congestion.
Drivers in the city lose an average of £123 of fuel each year, and emit an additional 173kg of C02 annually. Despite these high figures, Preston commuters only lost 30 hours a year due to bad traffic, against a national average of two days.

No specific reason was given for the congestion issues, but it is suggested that it’s because Preston is an economic centre for Lancashire, attracting commuters from a wide area.
In 2018, data from Go Compare revealed that the A6 in Preston was one of the worst roads in the country. The snarled-up section from Station Lane at Newsham to the Black Bull crossroads is such a logjam for traffic that it has now been branded one of the 10 most congested roads in Britain, outside London, rating alongside such beauties as the A34 through Birmingham city centre and Manchester’s A56 between Deansgate and the M60 for delays. Read more about that study here
How does Preston compare?
Advertisement
Hide AdAdvertisement
Hide AdElsewhere, Belfast came in first place for congestion, followed by Manchester. In Manchester, drivers spend an average of 46 hours stuck in traffic each year, releasing 150 kg of CO2 and costing commuters £107 in wasted fuel.
Data from the TomTom Traffic Index was used to record the number of hours lost, the amount of additional CO2 produced, and the cost of fuel wasted due to congestion. This data was collected on January 3, 2023 and assumes a 10km rush-hour commute within each city’s greater metro area.
Comment Guidelines
National World encourages reader discussion on our stories. User feedback, insights and back-and-forth exchanges add a rich layer of context to reporting. Please review our Community Guidelines before commenting.