
After a new report by the Office for National Statistics ranked all neighbourhoods in Lancashire based on their potential price growth, the county’s top 10 areas which have seen the biggest proportional price increases over the past 12 months has been revealed.
Take a look.
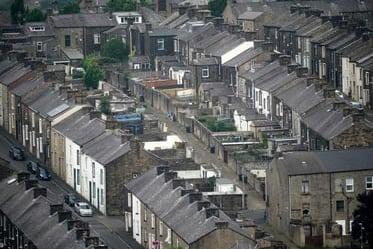
1. Blackburn with Darwen
The average house price in Blackburn with Darwen was £162,000 in March 2025 (provisional), up 16.9% from March 2024. This was higher than the rise in the North West (9.4%) over the same period. The average monthly private rent in Blackburn with Darwen was £665 in April 2025. This was an increase from £601 in April 2024, a 10.8% rise. Photo: ONS
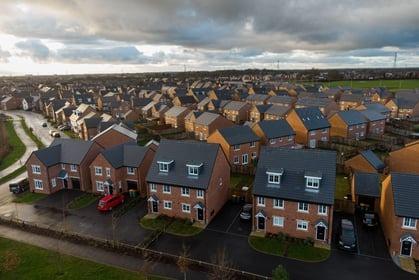
2. South Ribble
The average house price in South Ribble was £210,000 in March 2025 (provisional), up 9.8% from March 2024. This was higher than the rise in the North West (9.4%) over the same period. The average monthly private rent in South Ribble was £749 in April 2025. This was an increase from £704 in April 2024, a 6.3% rise. Photo: ONS
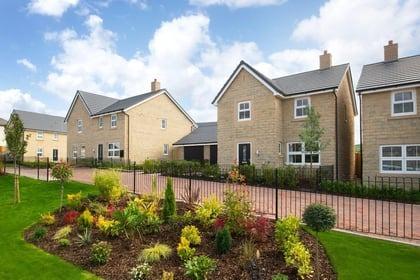
3. Burnley
The average house price in Burnley was £121,000 in March 2025 (provisional), up 7.7% from March 2024. This was lower than the rise in the North West (9.4%) over the same period. The average monthly private rent in Burnley was £599 in April 2025. This was an increase from £544 in April 2024, a 10.0% rise. Photo: ONS
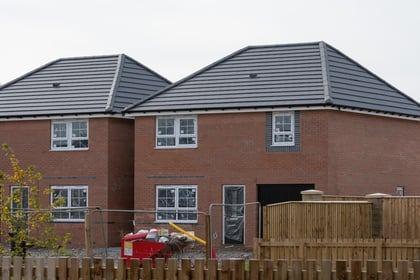
4. Rossendale
The provisional average house price in Rossendale in March 2025 was £200,000. This was higher than the average of £175,000 in March 2024 (revised), a 14.1% rise. The average monthly private rent in Rossendale was £756 in April 2025. This was an increase from £666 in April 2024, a 13.4% rise. Photo: ONS