



The list is compiled using figures showing the total number of recorded offences per 1,000 residents over a 12-month period, with several neighbourhoods recording crime rates well below the national average.
The national average currently stands at 91.4 offences per 1,000 people. Every area listed below recorded less than halfthat figure.
While no area is completely free from crime, the data provides an indication of where offence rates are lowest relative to population size.
The rankings are based on police-recorded crime data covering the 12 months from September 2024 to August 2025.
Crime rates are expressed as the number of recorded offences per 1,000 residents, allowing meaningful comparisons between areas of different sizes.
During this period, the national average stood at 91.4 offences per 1,000 people, with all areas listed recording rates significantly below that figure.
The figures reflect recorded offences, not perceptions of safety, and should be used as a general guide rather than a definitive measure of crime levels.
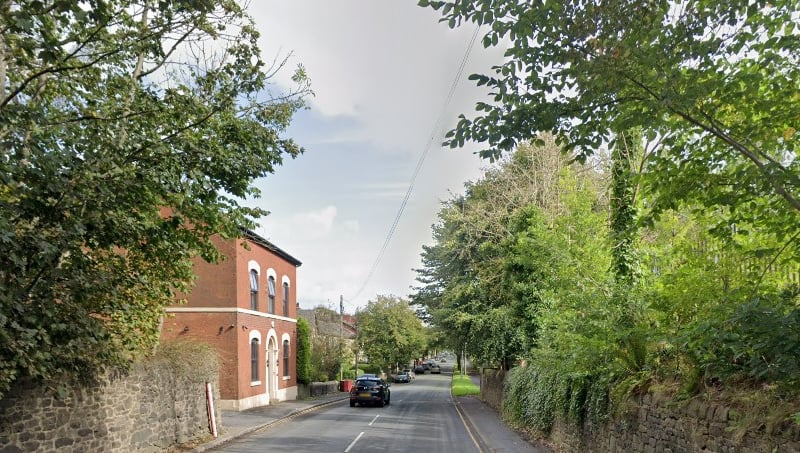
9. Lammack & Revidge
The area recorded 43.5 crimes per 1,000 residents over the past 12 months. | Google
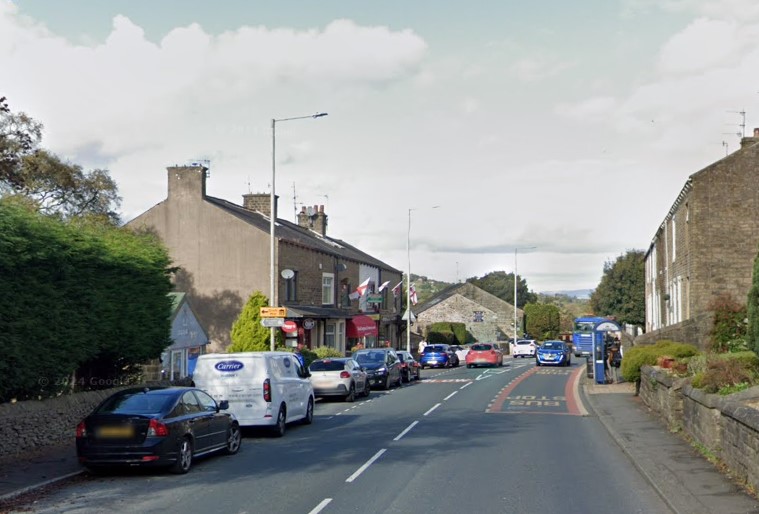
10. East Colne, Foulridge & Trawden
The area recorded 43.8 crimes per 1,000 residents over the past 12 months. | Google
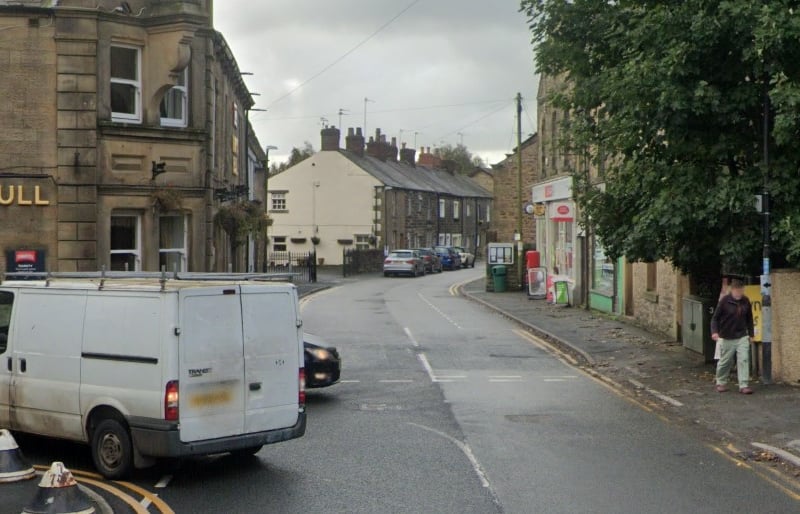
11. Longridge North & Ribchester
The area recorded 44.8 crimes per 1,000 residents over the past 12 months. | Google
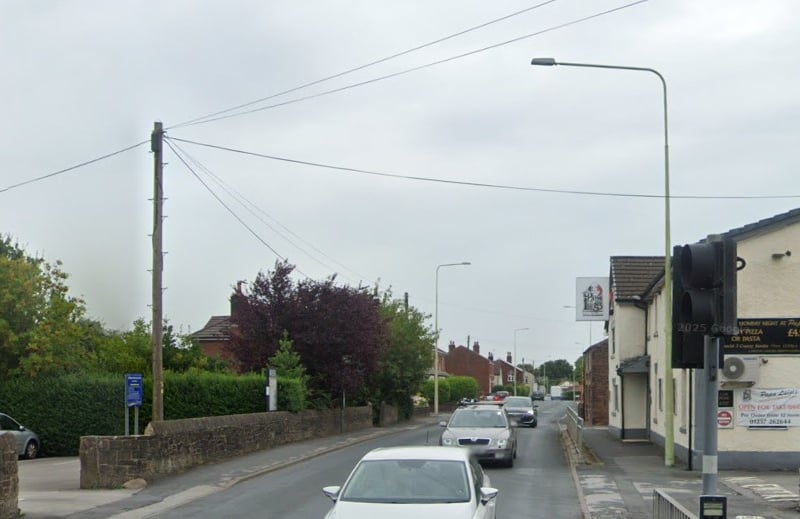
12. Euxton
The area recorded 44.9 crimes per 1,000 residents over the past 12 months. | Google