

The figures are based on the total number of recorded violent crime and sexual offences per 1,000 residents over a 12-month period.
Nationally, the average rate stands at 31.6 offences per 1,000 people, but several areas across Lancashire record levels far above that figure.
The rankings use police-recorded crime data covering the 12 months from September 2024 to August 2025, sourced from Police UK.
Incidents are mapped to where they occurred and assigned to small neighbourhood areas used for official statistics.
Each area name is followed by a short code, such as Blackpool 010 or Preston 017.
These are Lower Super Output Area (LSOA) codes, which divide towns and districts into neighbourhoods of around 1,000 to 3,000 residents, allowing crime levels to be compared more accurately.
Violent crime and sexual offences include incidents such as violence with and without injury, robbery, public order offences and recorded sexual offences.
While no area is free from crime and recorded figures do not capture every offence, the data provides a snapshot of where violent crime and sexual offences are most concentrated relative to population size across Lancashire:
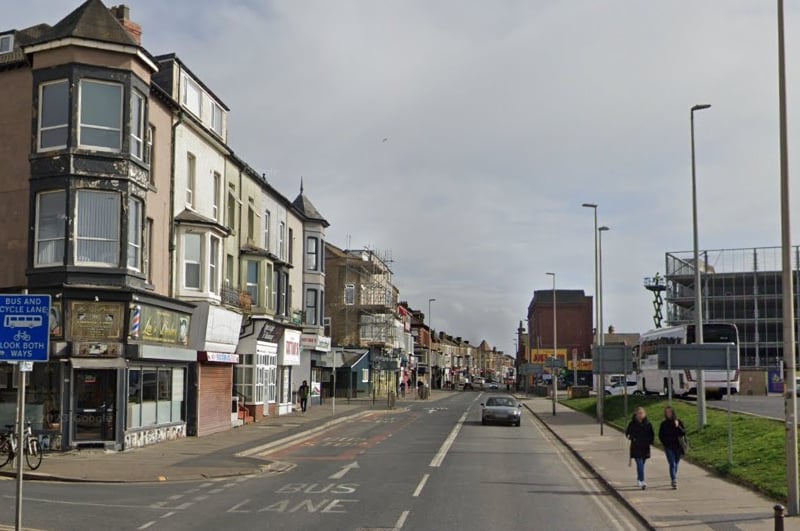
1. Central Blackpool - Blackpool 010
The area recorded 266.4 violent crime and sexual offences per 1,000 residents over the past 12 months, more than eight times the national average. | Google
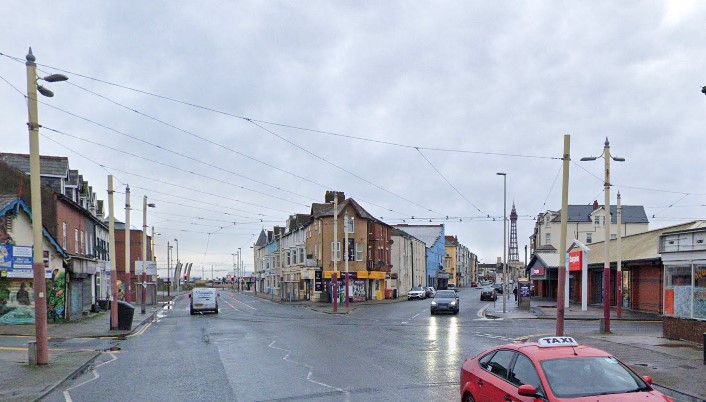
2. South Promenade and Seasiders Way - Blackpool 013
The area recorded 201.5 offences per 1,000 residents over the past 12 months, over six times the national average. | Google
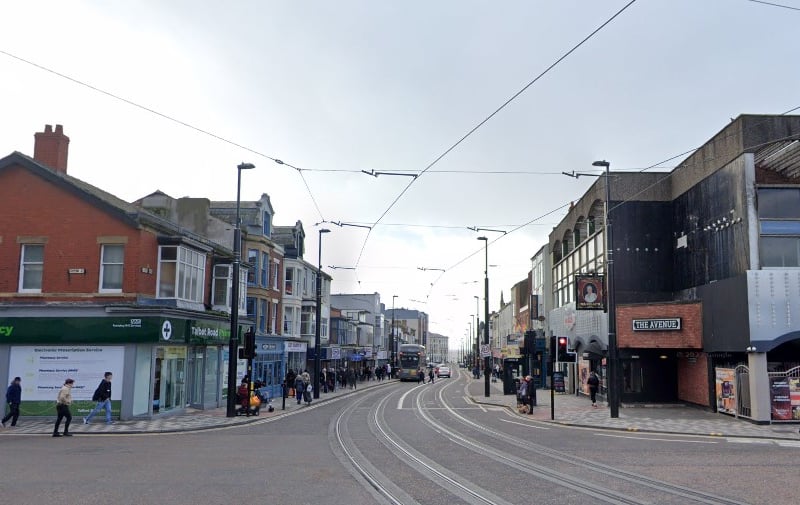
3. North Shore - Blackpool 006
The area recorded 192.1 offences per 1,000 residents over the past 12 months, more than six times the national average. | Google
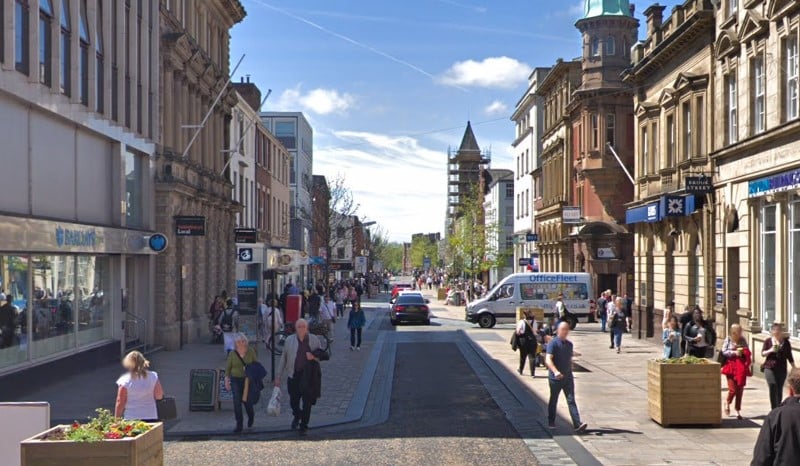
4. Preston City Centre - Preston 017
The area recorded 123.8 offences per 1,000 residents over the past 12 months, almost four times the national average. | Google