
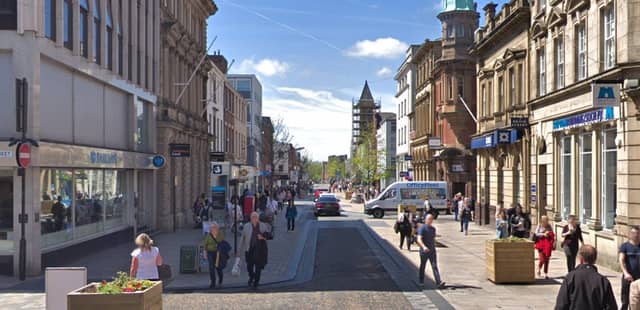


The figures are based on the total number of recorded drug offences per 1,000 residents over a 12-month period.
Nationally, the average currently stands at 3.1 drug offences per 1,000 people, meaning several areas in Preston are recording significantly higher rates.
The rankings use police-recorded crime data covering the 12 months from September 2024 to August 2025, sourced from Police UK.
Incidents are mapped to where they occurred and assigned to small neighbourhood areas used for official statistics.
Each area is followed by a short code, such as Preston 017 or Preston 015.
These are known as Lower Super Output Areas (LSOAs) - neighbourhoods of around 1,000 to 3,000 residents that help police and analysts compare crime levels more accurately.
While no area is free from crime and recorded figures do not capture every offence, the data offers a snapshot of where drug crime is most concentrated relative to population size across the city and surrounding areas:
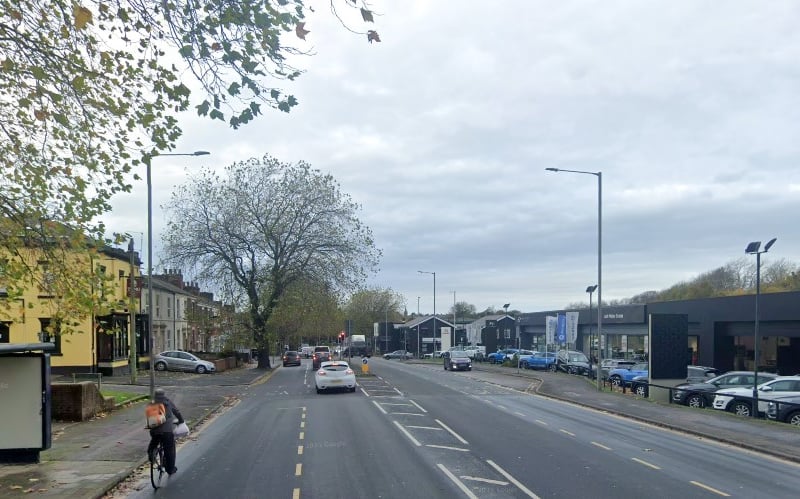
5. Plungington & University - Preston 012
Logged 4.1 drug offences per 1,000 residents. | Google
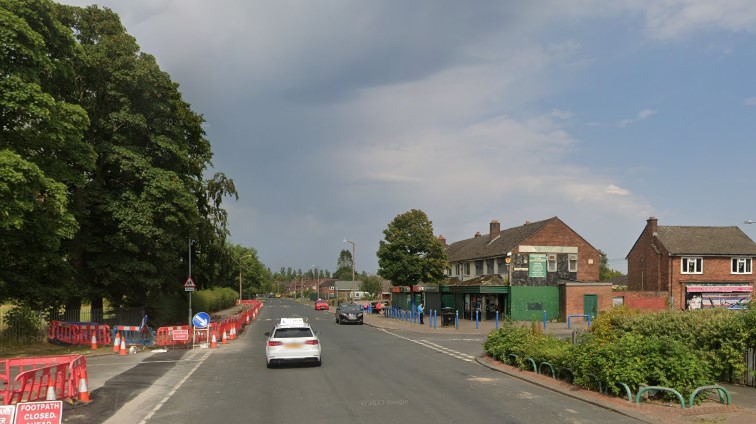
6. Ribbleton - Preston 009
Recorded 3.8 offences per 1,000 residents, slightly above the England average. | Google
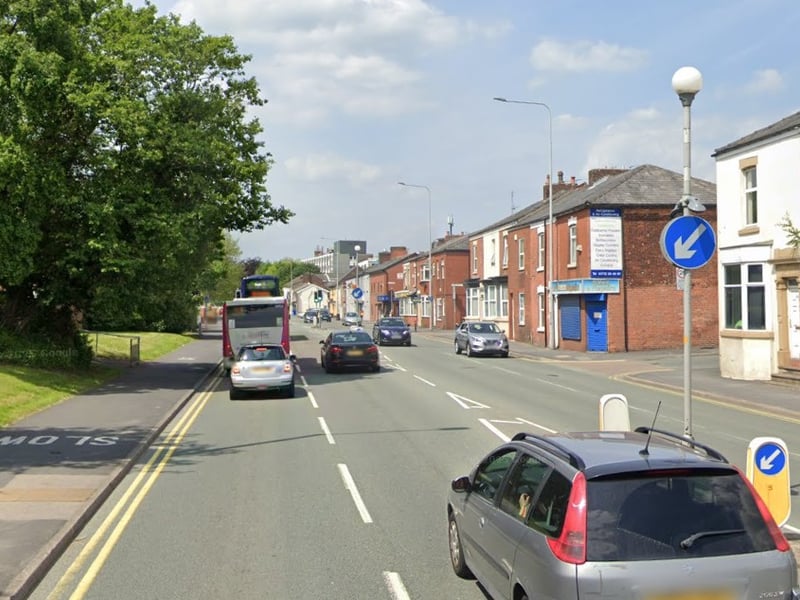
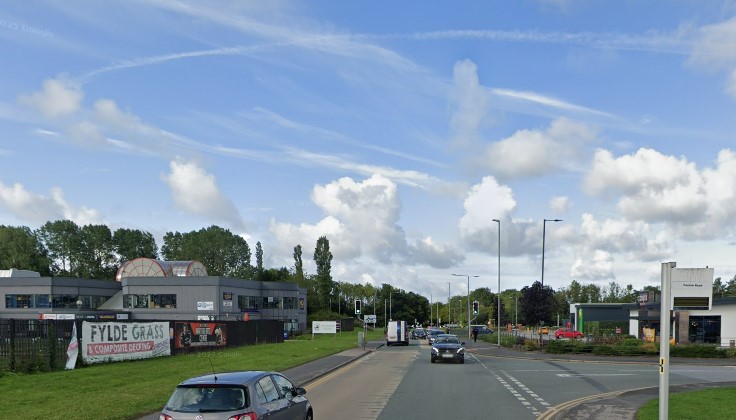
8. Longsands - Preston 004
Recorded 2.4 offences per 1,000 residents, below the national average. | Google