

The graphs below based on the latest Public Health England (PHE) data taken from the Gov.uk website, show how the virus has affected each area of Preston since the start of lockdown as well as the impact in recent weeks.
Data used includes lab confirmed positive cases of Coronavirus (COVID-19) reported by September 11 with specimen date up to September 9, 2020.
Here are the number of cases recorded each week since the start of lockdown:
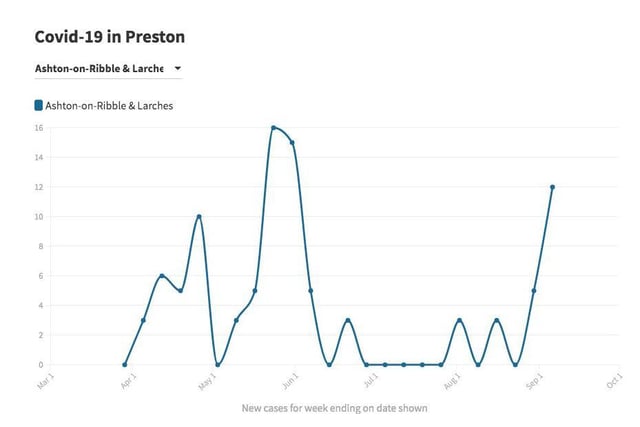
1. Ashton-on-Ribble & Larches
Ashton-on-Ribble & Larches - Week 13 - 0 cases / Week 14 - 3 cases / Week 15 - 6 cases / Week 16 - 5 cases / Week 17 - 10 cases / Week 18 - 0 cases / Week 19 - 3 cases / Week 20 - 5 cases / Week 21 - 16 cases / Week 22 - 15 cases / Week 23 - 5 cases / Week 24 - 0 cases / Week 25 - 3 cases / Week 26 - 0 cases / Week 27 - 0 cases / Week 28 - 0 cases / Week 29 - 0 cases / Week 30 - 0 cases / Week 31 - 3 cases / Week 32 - 0-2 cases / Week 33 - 3 cases / Week 34 - 0-2 cases / Week 35 - 5 cases / Week 36 - 12 cases
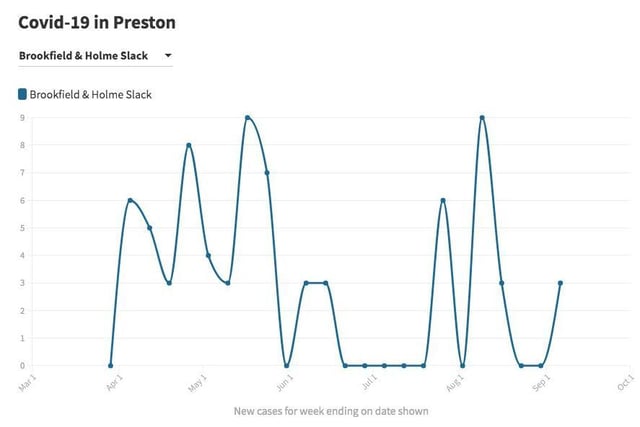
2. Brookfield & Holme Slack
Brookfield & Holme Slack - Week 13 - 0 cases / Week 14 - 6 cases / Week 15 - 5 cases / Week 16 - 3 cases / Week 17 - 5 cases / Week 18 - 4 cases / Week 19 - 3 cases / Week 20 - 9 cases / Week 21 - 7 cases / Week 22 - 0 cases / Week 23 - 3 cases / Week 24 - 3 cases / Week 25 - 0 cases / Week 26 - 0 cases / Week 27 - 0 cases / Week 28 - 0 cases / Week 29 - 0 cases / Week 30 - 6 cases / Week 31 - 0-2 cases / Week 32 - 9 cases / Week 33 - 3 cases / Week 34 - 0-2 cases / Week 35 - 0-2 cases / Week 36 - 3 cases
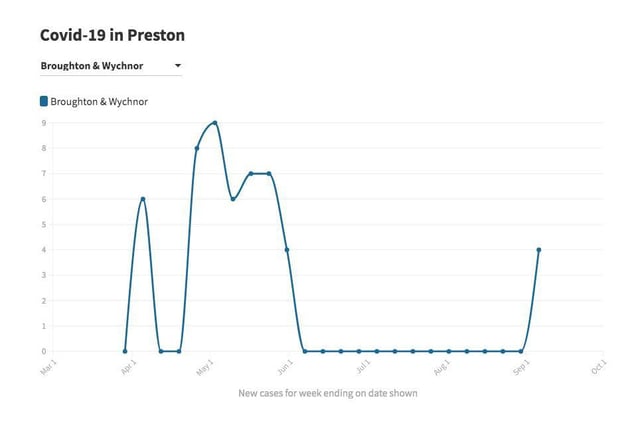
3. Broughton & Wychnor
Broughton & Wychnor - Week 13 - 0 cases / Week 14 - 6 cases / Week 15 - 0 cases / Week 16 - 0 cases / Week 17 - 8 cases / Week 18 - 9 cases / Week 19 - 6 cases / Week 20 - 7 cases / Week 21 - 7 cases / Week 22 - 4 cases / Week 23 - 0 cases / Week 24 - 0 cases / Week 25 - 0 cases / Week 26 - 0 cases / Week 27 - 0 cases / Week 28 - 0 cases / Week 29 - 0 cases / Week 30 - 0 cases / Week 31 - 0 cases / Week 32 - 0-2 cases / Week 33 - 0-2 cases / Week 34 - 0-2 cases / Week 35 - 0-2 cases / Week 36 - 4 cases
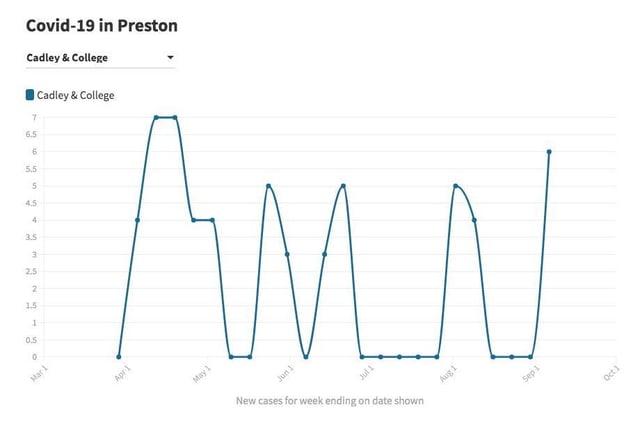
4. Cadley & College
Cadley & College - Week 13 - 0 cases / Week 14 - 4 cases / Week 15 - 7 cases / Week 16 - 7 cases / Week 17 - 4 cases / Week 18 - 4 cases / Week 19 - 0 cases / Week 20 - 0 cases / Week 21 - 5 cases / Week 22 - 3 cases / Week 23 - 0 cases / Week 24 - 3 cases / Week 25 - 3 cases / Week 26 - 0 cases / Week 27 - 0 cases / Week 28 - 0 cases / Week 29 - 0 cases / Week 30 - 0 cases / Week 31 - 5 cases / Week 32 - 4 cases / Week 33 - 0-2 cases / Week 34 - 0-2 cases / Week 35 - 0-2 cases / Week 36 - 6 cases