

The Public Health England (PHE) data taken from the Gov.uk website includes lab confirmed positive cases of Covid-19 reported by August 5, 2020 with a specimen date up to August 2, 2020. 2020.
Below are the number of cases recorded weekly (mapped for each area of Preston) since the start of lockdown - areas are listed from lowest to highest total number of cases.
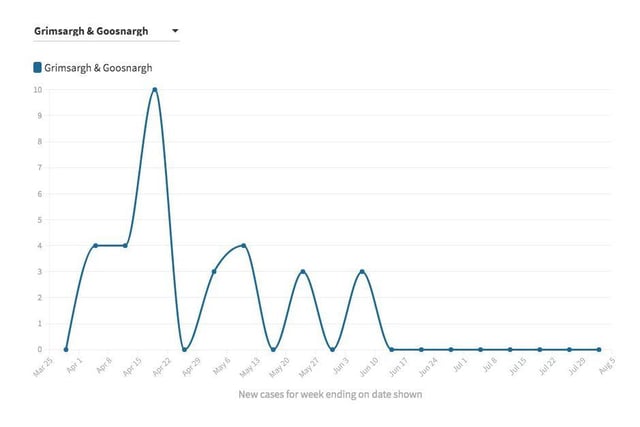
1. Grimsargh & Goosnargh - 31 cases
Grimsargh & Goosnargh - Week 13 - 0 cases /Week 14 - 4 cases /Week 15- 4 cases /Week 16- 10 cases /Week 17 - 0 cases /Week 18 - 3 cases /Week 19 - 4 cases /Week 20 - 0 cases /Week 21 - 3 cases /Week 22 - 0 cases /Week 23 - 3 cases /Week 24 - 0 cases /Week 25 - 0 cases /Week 26 - 0 cases /Week 27- 0 cases /Week 28 - 0 cases /Week 29 - 0 cases /Week 30 - 0 cases /Week 31 - 0 cases /
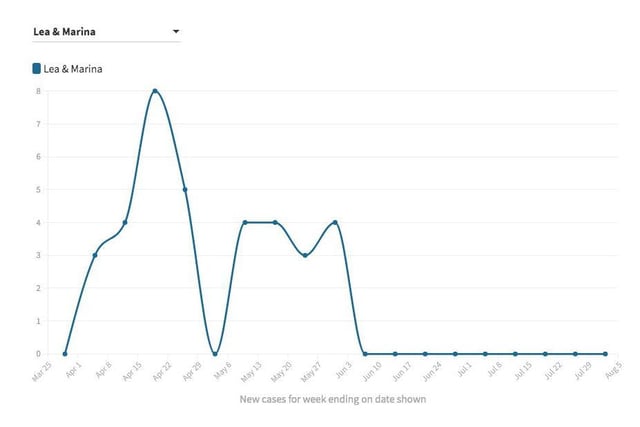
2. Lea & Marina - 35 cases
Lea & Marina - Week 13 - 0 cases /Week 14 - 3 cases /Week 15- 4 cases /Week 16- 8cases /Week 17 - 5 cases /Week 18 - 0 cases /Week 19 - 4 cases /Week 20 - 4 cases /Week 21 - 3 cases /Week 22 - 4 cases /Week 23 - 0 cases /Week 24 - 0 cases /Week 25 - 0 cases /Week 26 - 0 cases /Week 27- 0 cases /Week 28 - 0 cases /Week 29 - 0 cases /Week 30 - 0 cases /Week 31 - 0 cases /
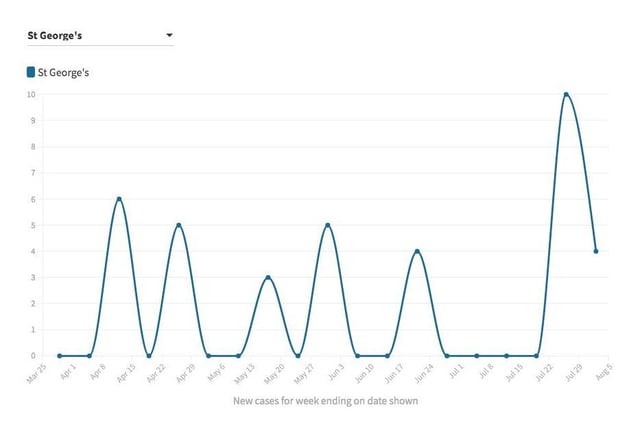
3. St George's - 37 cases
St George's - Week 13 - 0 cases /Week 14 - 0cases /Week 15- 6cases /Week 16- 0cases /Week 17 - 5 cases /Week 18 - 0 cases /Week 19 - 0 cases /Week 20 - 3 cases /Week 21 - 0 cases /Week 22 - 5 cases /Week 23 - 0 cases /Week 24 - 0 cases /Week 25 - 4 cases /Week 26 - 0 cases /Week 27- 0 cases /Week 28 - 0 cases /Week 29 - 0 cases /Week 30 - 10 cases /Week 31 - 4 cases /
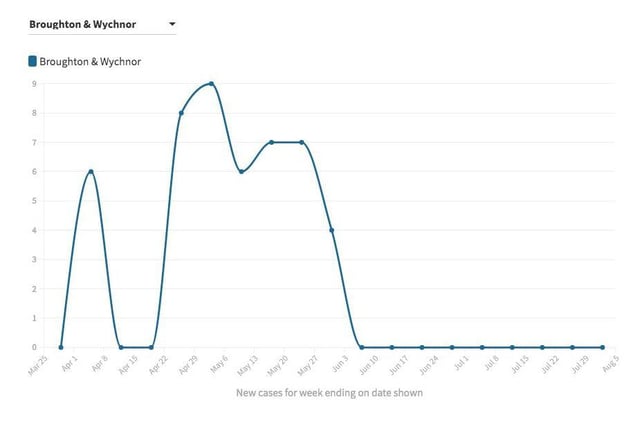
4. Broughton & Wychnor - 47 cases
Broughton & Wychnor - Week 13 - 0 cases /Week 14 - 6 cases /Week 15- 0 cases /Week 16- 0cases /Week 17 - 8 cases /Week 18 - 9 cases /Week 19 - 6 cases /Week 20 - 7 cases /Week 21 - 7 cases /Week 22 - 4 cases /Week 23 - 0 cases /Week 24 - 0 cases /Week 25 - 0 cases /Week 26 - 0 cases /Week 27- 0 cases /Week 28 - 0 cases /Week 29 - 0 cases /Week 30 - 0 cases /Week 31 - 0 cases /