
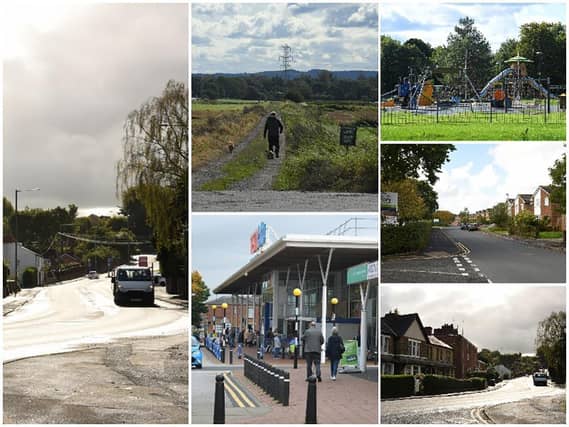

The latest figures show 9 neighbourhoods have seen a drop in infections, while 6 have seen cases rise in the latest seven-day period.
Here we reveal which neighbourhoods have seen the biggest rise and fall in case rates per 100,000 people between January 29 to February 5.
Thanks for reading. If you value what we do and are able to support us, a digital subscription is just £1 per month for the first two months. Try us today by clicking here
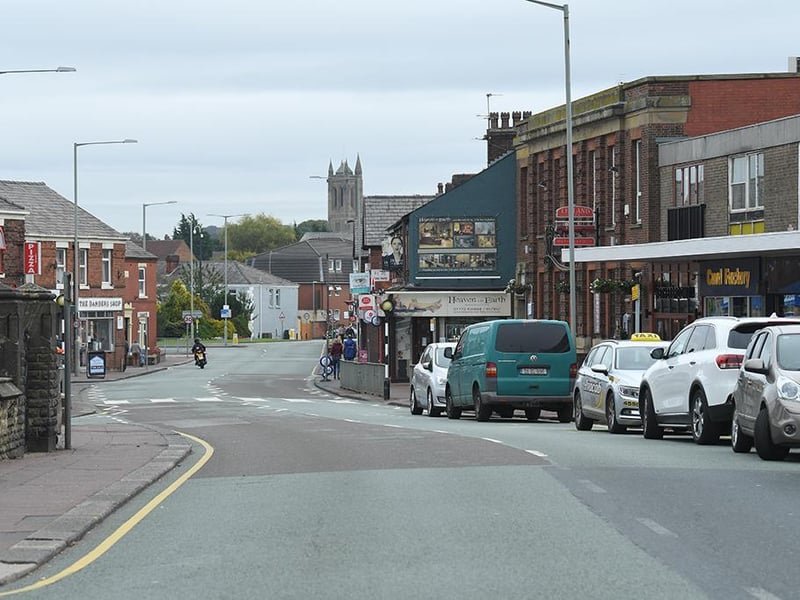
9. Leyland North - down 8%
Leyland North has seen rates of positive Covid cases fall by 8%, from January 29 to February 5.
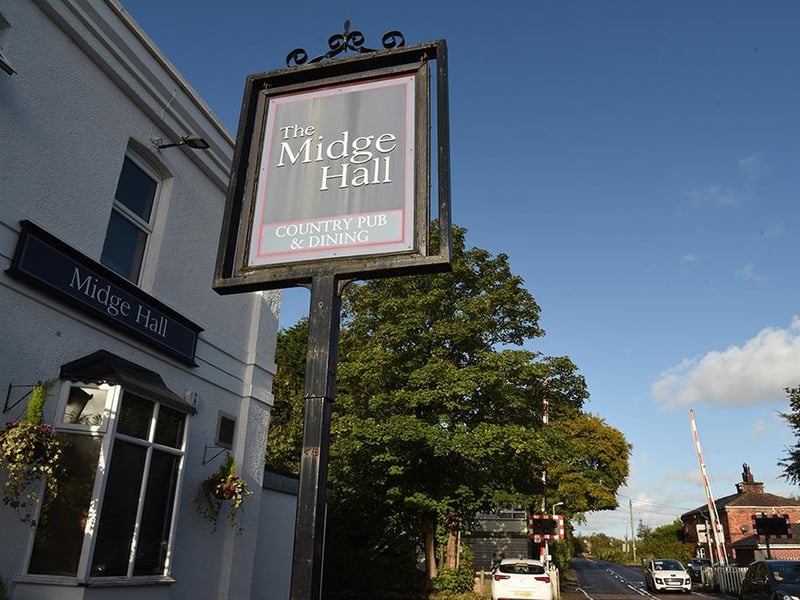
10. Moss Side - change 0%
Moss Side has seen rates of positive Covid cases change by 0%, from January 29 to February 5.
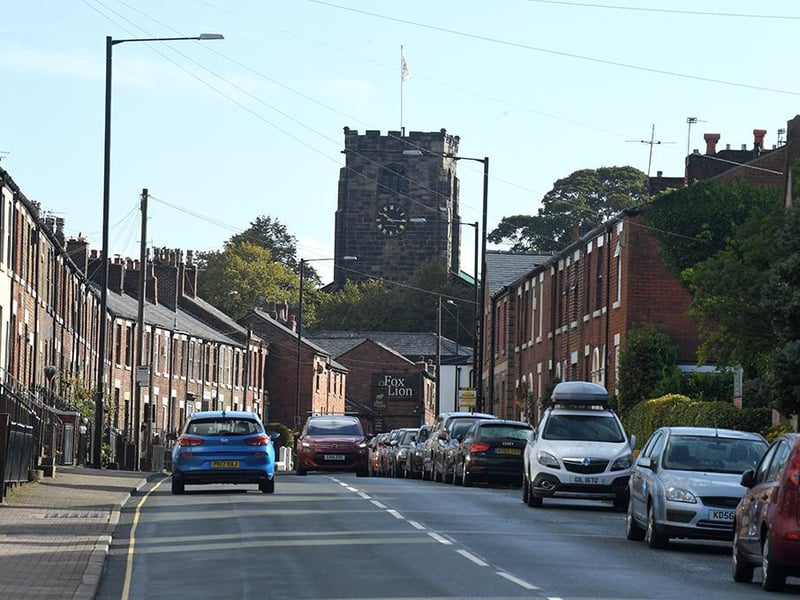
11. Leyland South West - change 0%
Leyland South West has seen rates of positive Covid cases change by 0%, from January 29 to February 5.
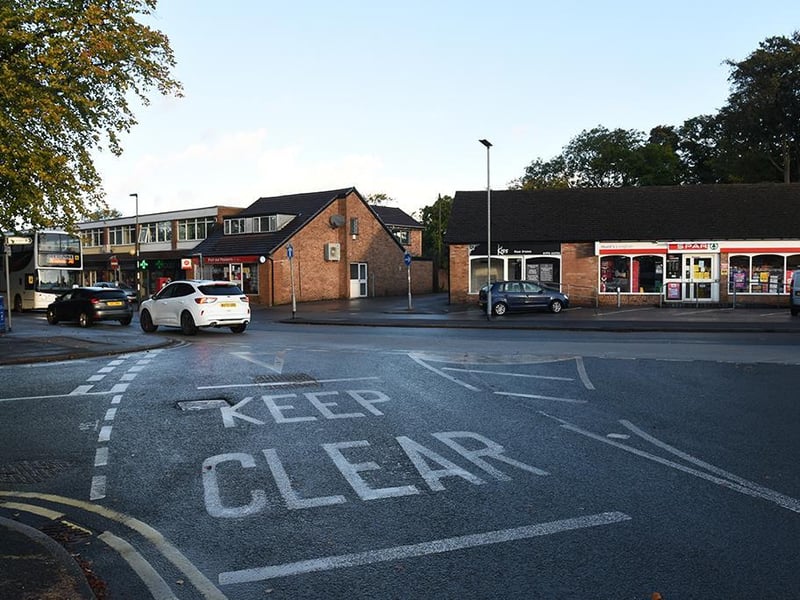
12. Longton & Walmer Bridge - up 2.6%
Longton & Walmer Bridge has seen rates of positive Covid cases rise by 2.6%, from January 29 to February 5.