

The new lockdown rules mean that all non-essential shops and businesses will be forced to close, schools will move to remote learning and there will be tighter restrictions on when people can leave their homes.
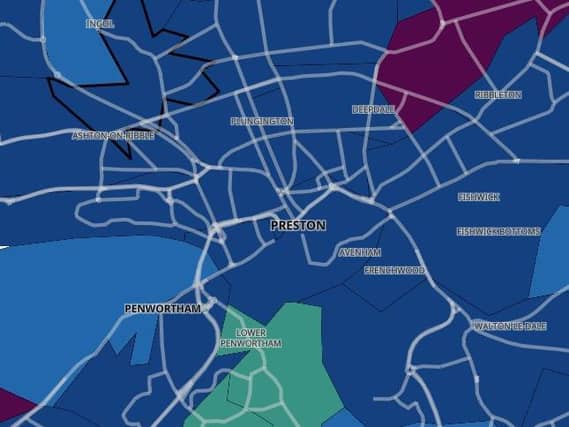
Here is the latest Public Health England data, which show the the case rate for each area of Preston for the seven days to December 30, 2020.
Seven–day rates are expressed per 100,000 population and are calculated by dividing the seven day count by the area population and multiplying by 100,000.
The data below includes every area of the city, with areas listed where cases are falling fastest first, followed by areas where cases are rising, from lowest to highest percentage. (Please note that the images used for illustrative purposes only and not linked to the data.).
In these confusing and worrying times, local journalism is more vital than ever. Thanks to everyone who helps us ask the questions that matter by taking out a digital subscription or by buying a paper.

9. Preston Town Centre - cases up 22.2%
There were 22 cases recorded in Preston Town Centre, up 22.2%. The current rolling case rate is 201.8.
10. Fulwood - cases up 23.8%
There were 26 cases recorded in Fulwood, up 23.8%. The current rolling case rate is 293.7.
11. Haslam Park - cases up 38.9%
There were 25 cases recorded in Haslam Park, up 38.9%. The current rolling case rate is 378.8.
12. St Matthew's - cases up 53.8%
There were 20 cases recorded in St Matthew's, up 53.8%. The current rolling case rate is 230.0.