
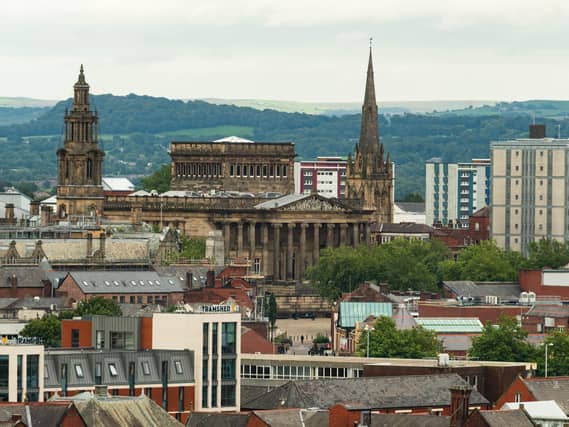

Figures from Public Health England show the seven-day rolling rate of new cases up to October 23.
The seven–day rates are expressed per 100,000 population and are calculated by dividing the seven day count by the area population and multiplying by 100,000, the government health body have said.
Images are used for illustrative purposes only and are not linked to the data in the article.
Below are the areas with a coronavirus rate of over 500 new cases in every 100,000 people, from lowest to highest.
Thanks for reading. If you value what we do and are able to support us, a digital subscription is just £1 per month for the first two months. Try us today by clicking here
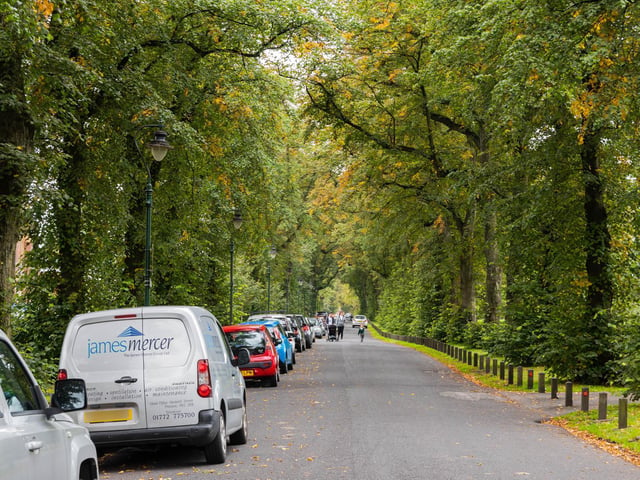
5. Moor Park
In the Moor Park neighbourhood, there was an average virus rate of 616.1 cases in every 100,000 people, recorded over the seven days to October 23.
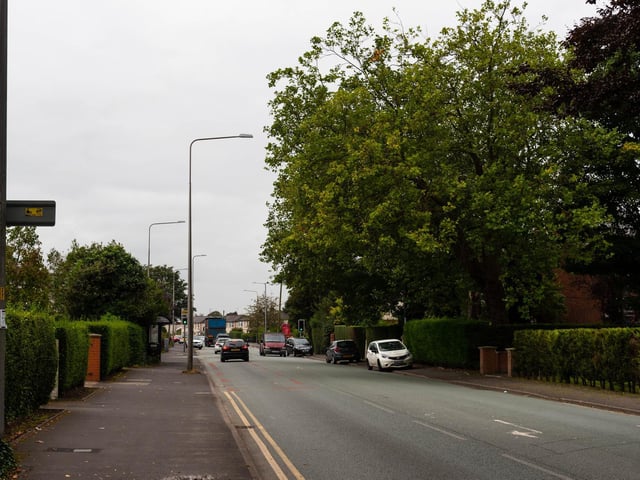
6. Ribbleton
In the Ribbleton neighbourhood, there was an average virus rate of 635.9 cases in every 100,000 people, recorded over the seven days to October 23.
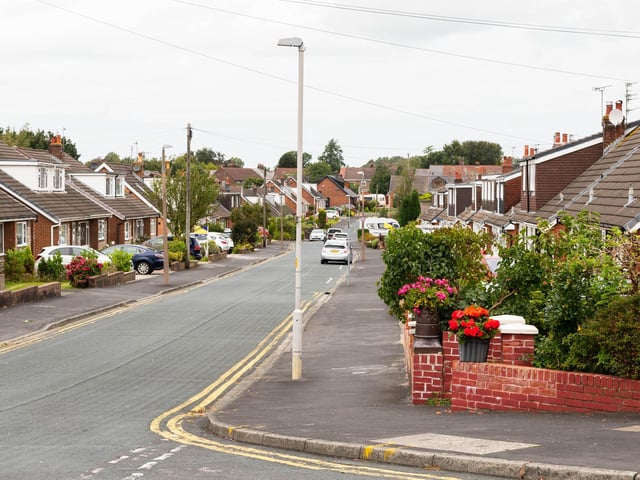
7. Longsands
In the Longsands neighbourhood, there was an average virus rate of 710.7 cases in every 100,000 people, recorded over the seven days to October 23.
8. Cadley & College
In the Cadley & College neighbourhood, there was an average virus rate of 875.9 cases in every 100,000 people, recorded over the seven days to October 23.