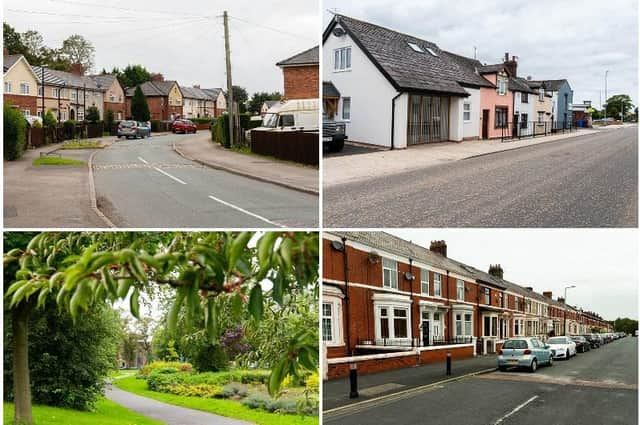
Across the UK, there were 1.2 million positive test results in the week to January 6, a 9% rise from the week before, with the average case rate being 1,736.8.
Closer to home, Preston' s average is significantly higher at 2,251.2 with the St George's area seeing cases rise by 100% in seven days to January 6.
See below for the latest Covid data in every area of Preston.
Want to see fewer ads? Subscribers to the Lancashire Post get access to the ad-lite version of our website, which features 70% fewer ads and faster load times for a better experience. Find out more
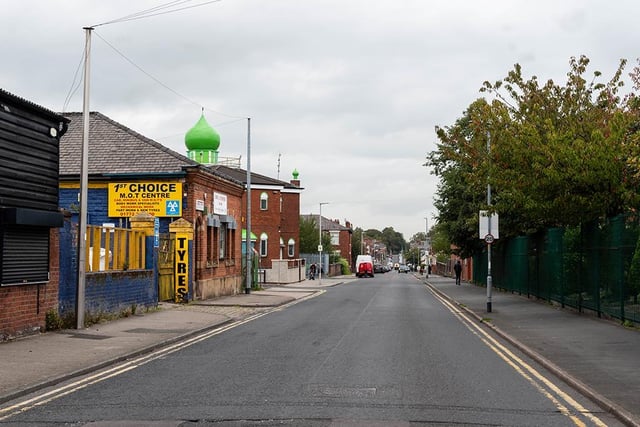
1. St George’s
St George’s had 1,412.5 Covid-19 cases per 100,000 people in the latest week, a rise of 108% from the week before.
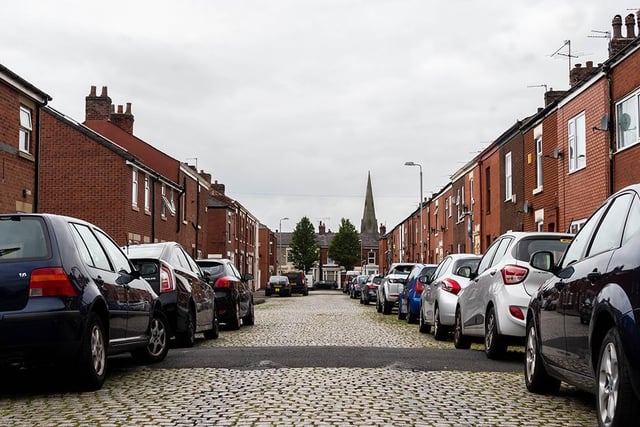
2. St Matthew’s
St Matthew’s had 2,218.7 Covid-19 cases per 100,000 people in the latest week, a rise of 95.1% from the week before.
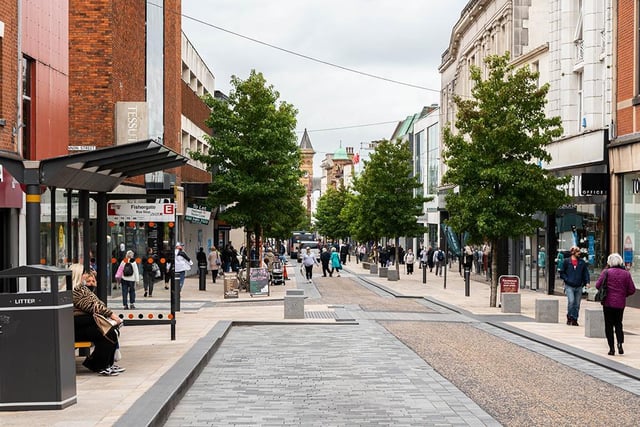
3. City Centre
The City Centre had 2,402.6 Covid-19 cases per 100,000 people in the latest week, a rise of 94.9% from the week before.
4. Cadley & College
Cadley & College had 2,838.1 Covid-19 cases per 100,000 people in the latest week, a rise of 54.2% from the week before.
