

There were 763 new cases, which is equivalent to 641.9 per 100,000 people.The figures, for the seven days to October 14, are based on the number of people who have tested positive for Covid-19 in either a lab-reported or rapid lateral flow test, by specimen date.
With cases on the rise in Chorley we’ve delved further to take a look at each individual area of the town.
We’re very excited to announce the launch of our new and improved app. To support the relaunch we want to offer you the chance to subscribe to our Digital+ package, which includes the app, with a discount of 35% off. Checkout using promo code NWAPP35 HERE
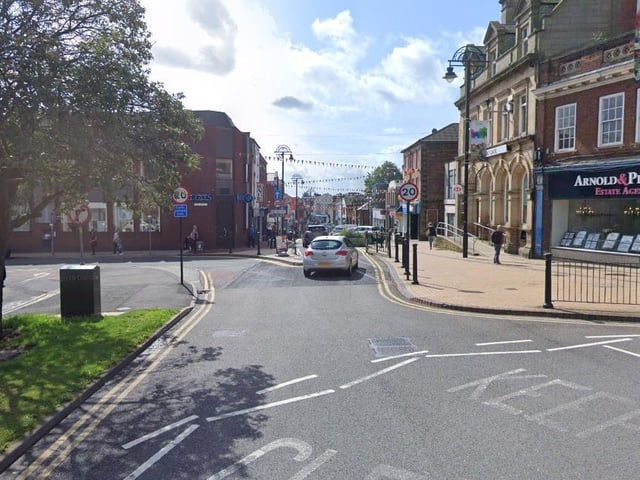
5. Chorley Town and South
In Chorley Town and South there were 72 cases in the seven days to October 13, a rise of 22% and a case rate of 727.1 per 100,000 people.
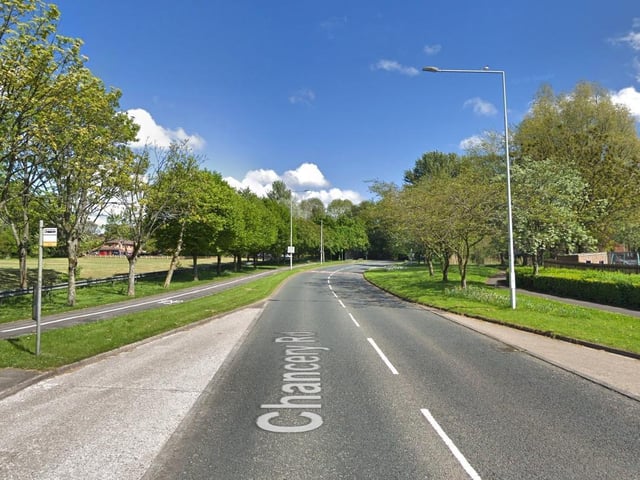
6. Chorley West
In Chorley West there were 61 cases in the seven days to October 13, a rise of 10.9% and a case rate of 545.0 per 100,000 people.
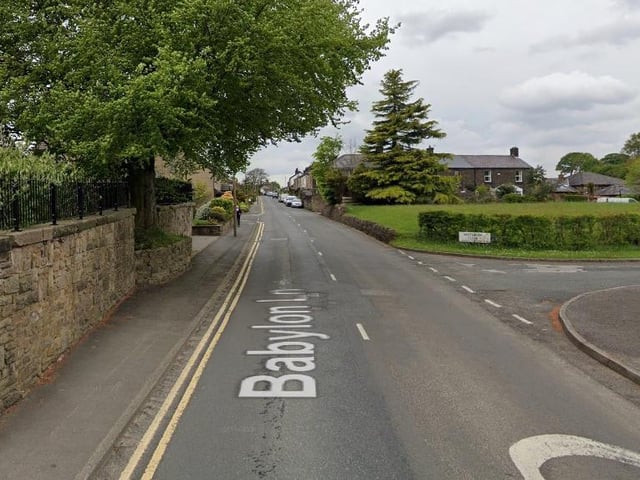
7. Adlington and Rivington
In Adlington and Rivington there were 53 cases in the seven days to October 13, a rise of 1.9% and a case rate of 510.6 per 100,000 people.
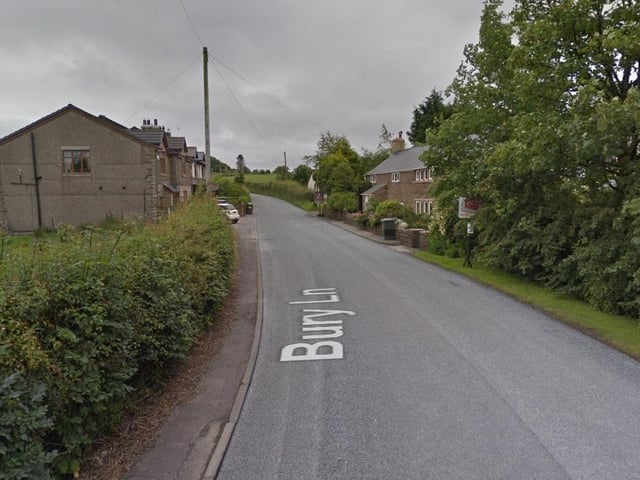
8. Brindle and Withnell
In Brindle and Withnell there were 32 cases in the seven days to October 13, which represented no change from the previous week and a case rate of 528.8 per 100,000 people.