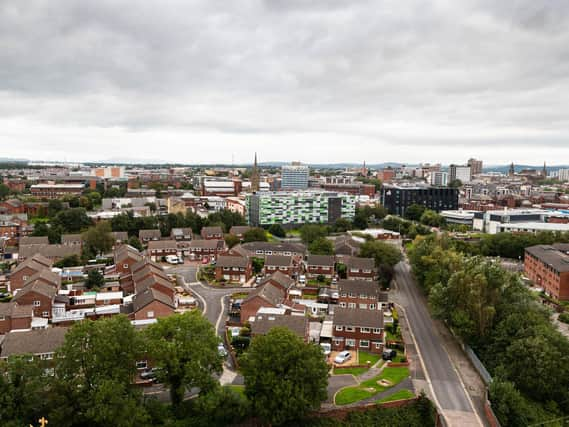
The latest government health figures, which are based on data recorded in the seven days to November 7, highlights the areas in the city where Covid-19 cases are increasing.
The seven–day rates are expressed per 100,000 population and are calculated by dividing the seven day count by the area population and multiplying by 100,000, the government health body have said.
Images are for illustrative purposes only and are not linked to the data in the article.
Below are the latest infection rates for each area of the city where rates are increasing, from lowest to highest percentage.
1. Ribbleton
A total of 35 cases were recorded in Ribbleton in the seven days to November 7. The data shows the number of cases have risen by 6.1%, while the rate of infection is currently 434.1 per 100,000 people.
2. Moor Park
A total of 31 cases were recorded in Moor Park in the seven days to November 7. The data shows the number of cases have risen by 19.2%, while the rate of infection is currently 342.4 per 100,000 people.
3. Fulwood
A total of 48 cases were recorded in Fulwood in the seven days to November 7. The data shows the number of cases have risen by 37.1%, while the rate of infection is currently 542.1 per 100,000 people.
4. Ashton-on-Ribble & Larches
A total of 50 cases were recorded in Ashton-on-Ribble & Larches in the seven days to November 7. The data shows the number of cases have risen by 38.9%, while the rate of infection is currently 468.9 per 100,000 people.
