


The latest figures show 12 neighbourhoods have seen a drop in infections, while five have seen cases rise in the latest seven-day period.
Here we reveal which neighbourhoods have seen the biggest rise and fall in case rates per 100,000 people between February 4 to February 11.
Please note that the images used for illustrative purposes only and not linked to the data.
In these confusing and worrying times, local journalism is more vital than ever. Thanks to everyone who helps us ask the questions that matter by taking out a digital subscription or by buying a paper.
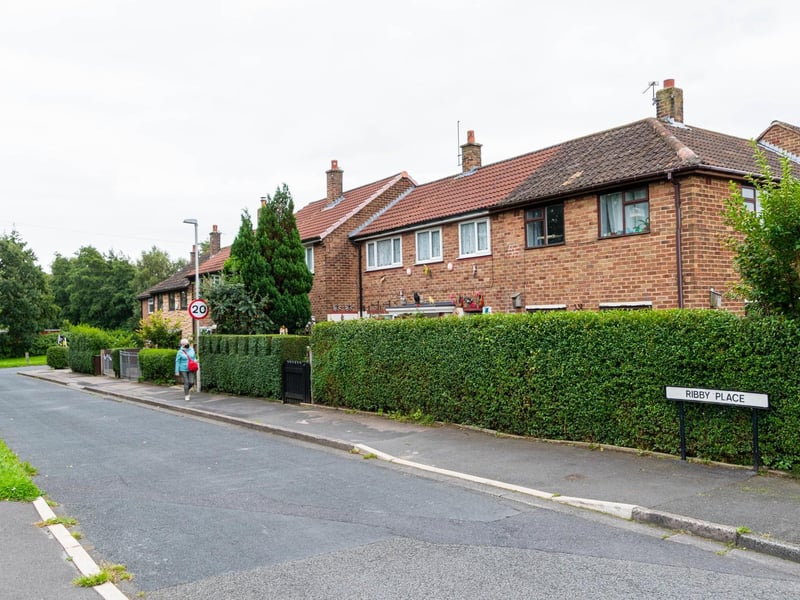
13. Ashton-on-Ribble & Larches - up 3.0%
Ashton-on-Ribble & Larches has seen rates of positive Covid cases rise by 3%, from February 4 to February 11.
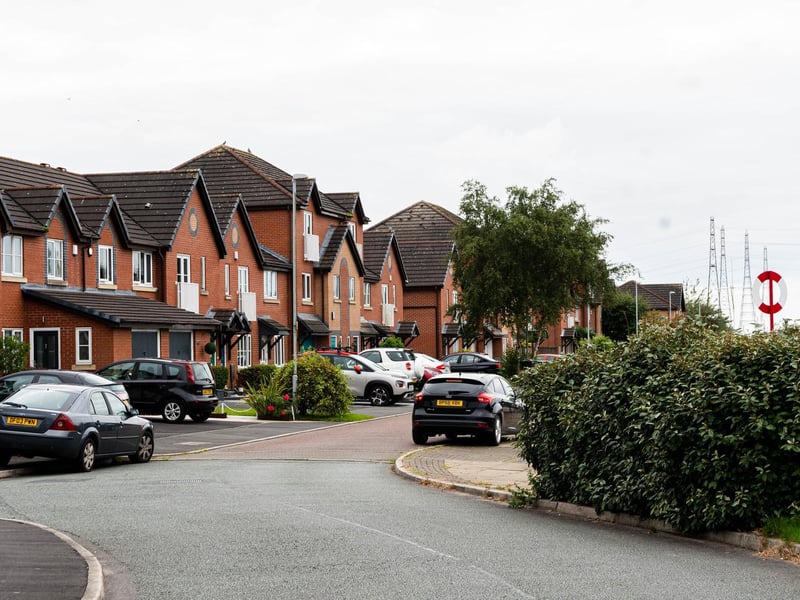
14. Lea & Marina - up 4.3%
Lea & Marina has seen rates of positive Covid cases rise by 4.3%, from February 4 to February 11.
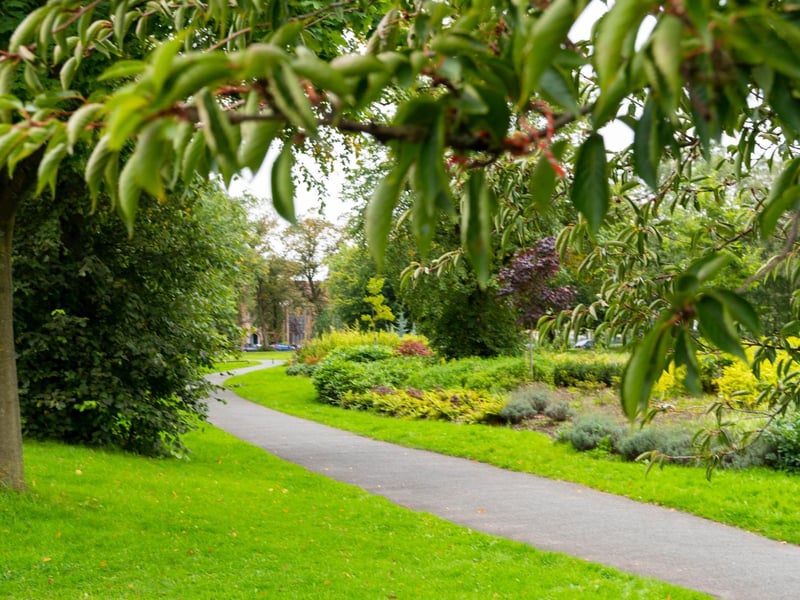
15. Moor Park - up 4.5%
Moor Park has seen rates of positive Covid cases rise by 4.5%, from February 4 to February 11.
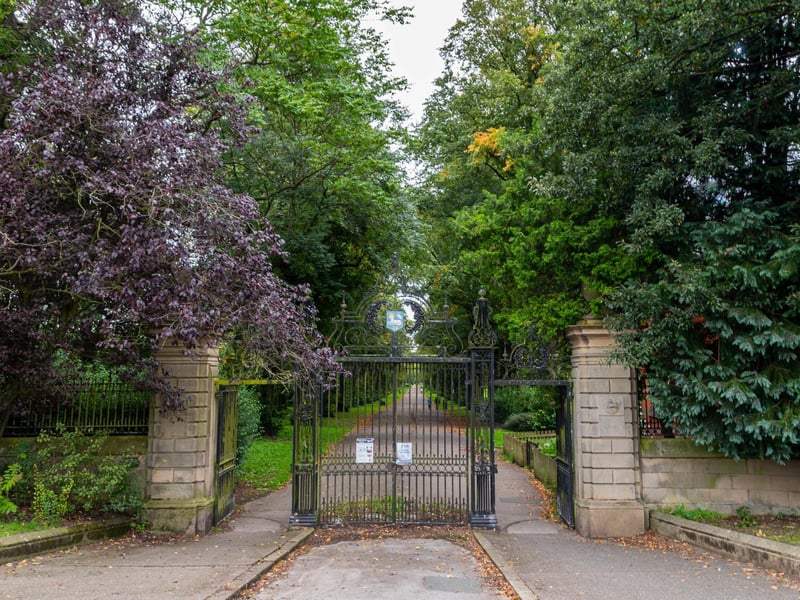
16. Haslam Park - up 42.8%
Haslam Park has seen rates of positive Covid cases rise by 42.8%, from February 4 to February 11.