
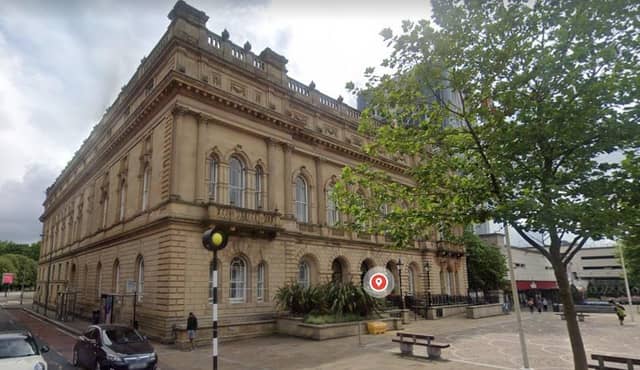

With the UK council tax increasing by 3.5 per cent on average, this is likely to raise people’s expectations of their local councils.
Keen to find out which council serves its residents the best, Claims.co.uk investigated 2016 to 2022 complaints data from the Local Government Ombudsman to uncover the most complained about councils in Lancashire, alongside which council has improved the most using historical figures.
Here are the top seven most complained about councils on the list you can view the full study here.
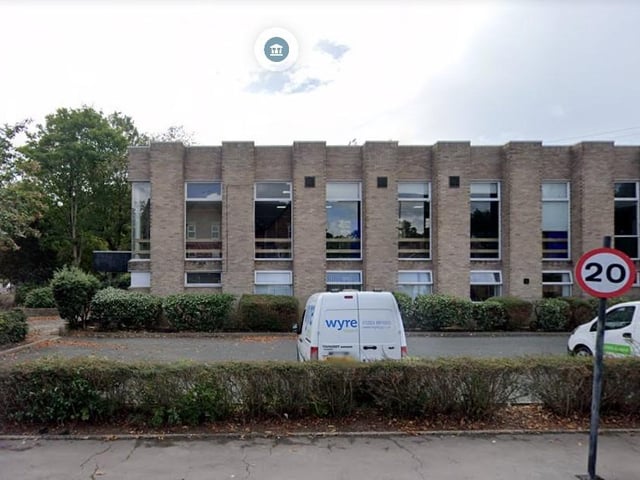
5. Wyre Borough Council
Wyre Borough Council No. of complaints per 10,000 people (2016-2022) - 8.4 % of complaints upheld - 33.33% Most common complaints - Planning & Development Photo: googke maps
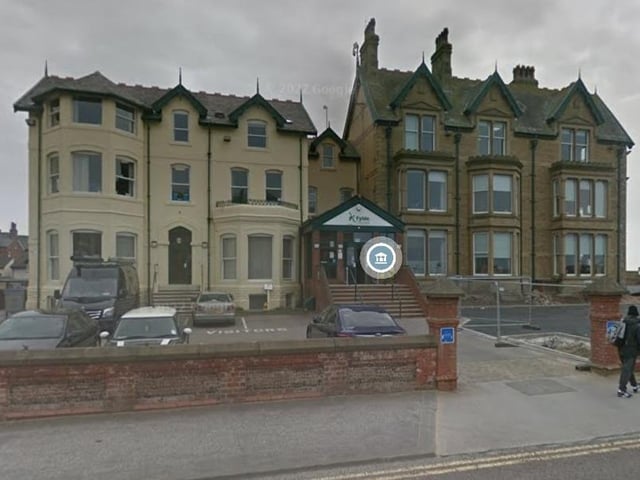
6. Fylde Borough Council
Fylde Borough Council No. of complaints per 10,000 people (2016-2022) - 8.3 % of complaints upheld - 47.62% Most common complaints - Planning & Development Photo: google maps