

But despite that, average house prices held up across England – even if there was a drop in sales.
It was the same a different picture in Preston however, where prices fell by 2.2% in the year to September 2020. Across North West, prices rose by 2.5%.
The ONS also publishes house price figures by Middle Layer Super Output Areas (MSOAs) – small geographic areas containing an average of 7,200 people.
These show 10 of the 17 MSOAs that make up Preston saw a rise in house prices over the same period.
Here we reveal which Preston neighbourhoods saw the strongest growth in the year to September 2020, from lowest to highest.
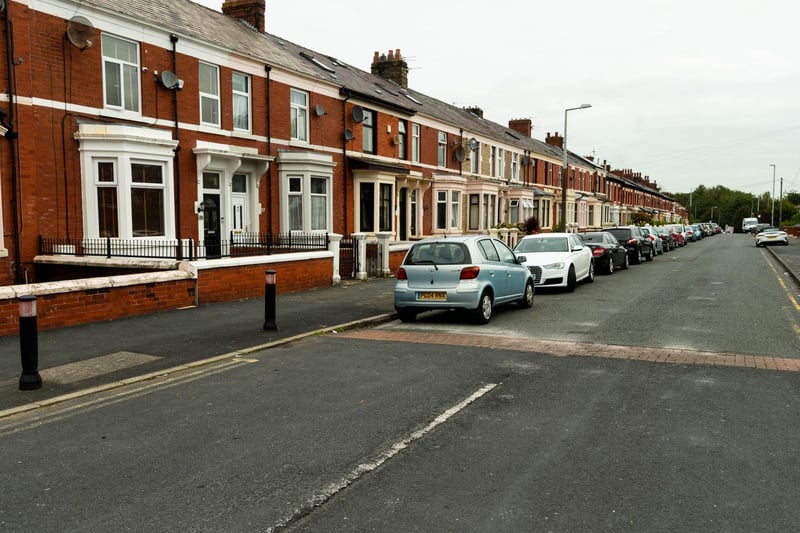
1. Frenchwood & Fishwick
In Frenchwood & Fishwick the average price rose to £98,557, up by 0.4% on the year to September 2019. Overall, 76 houses changed hands here between October 2019 and September 2020, a drop of 11%.
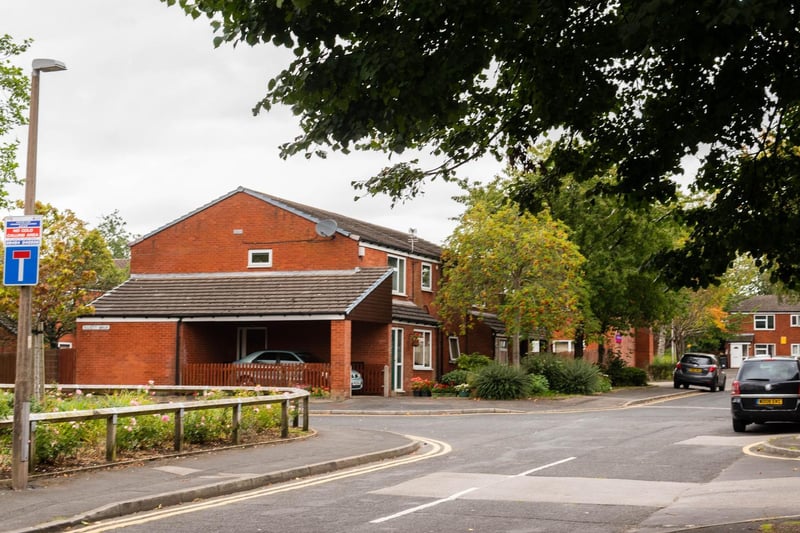
2. Plungington & University
In Plungington & University the average price rose to £103,692, up by 2.1% on the year to September 2019. Overall, 117 houses changed hands here between October 2019 and September 2020, a drop of 26%.
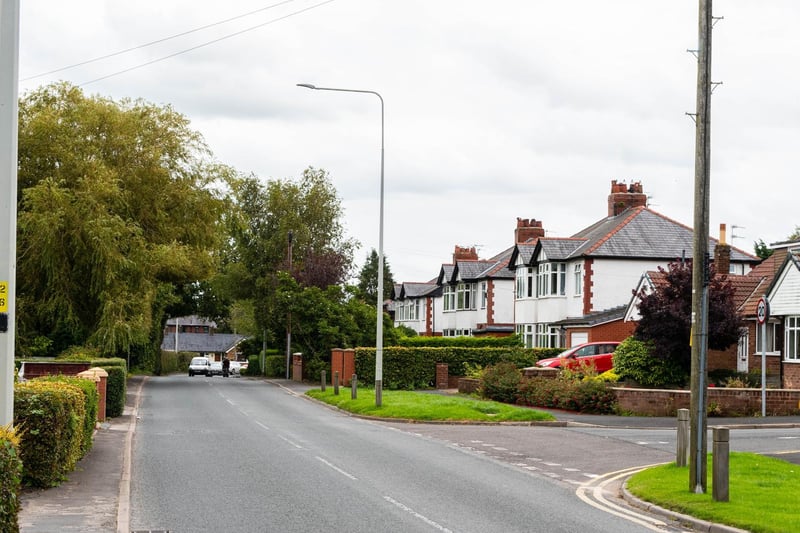
3. Broughton & Wychnor
In Broughton & Wychnor the average price rose to £278,189, up by 2.4% on the year to September 2019. Overall, 201 houses changed hands here between October 2019 and September 2020, a drop of 35%.
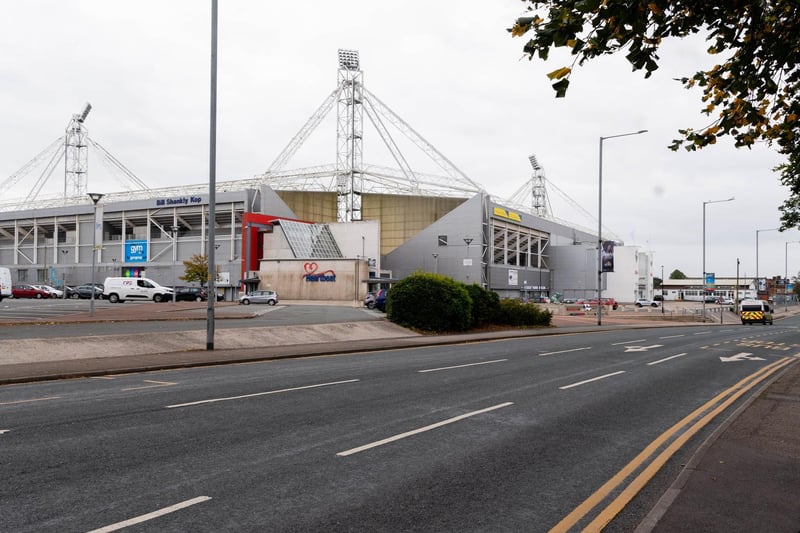
4. Moor Park
In Moor Park the average price rose to £93,514, up by 4.7% on the year to September 2019. Overall, 61 houses changed hands here between October 2019 and September 2020, a rise of 5%.