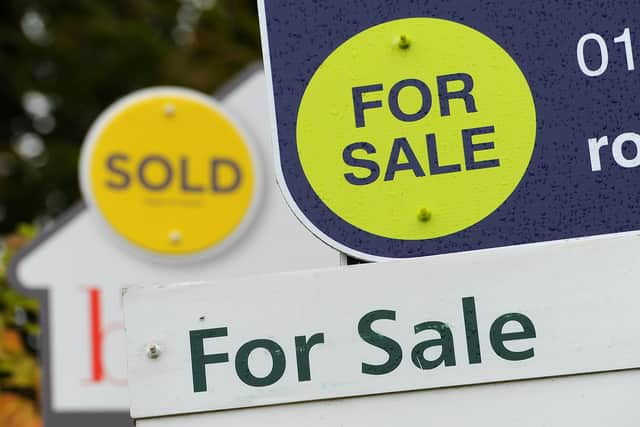
House prices increased slightly by 0.4%, in Preston in October, new figures show
and live on Freeview channel 276
The rise contributes to the longer-term trend, which has seen property prices in the area grow by 2.6% over the last year.
The average Preston house price in October was £165,554, Land Registry figures show – a 0.4% increase on September.
Advertisement
Hide AdAdvertisement
Hide AdOver the month, the picture was different to that across the North West, where prices decreased 0.4%, and Preston was above the 0.7% drop for the UK as a whole.
Over the last year, the average sale price of property in Preston rose by £4,200 – putting the area eighth among the North West’s 35 local authorities with price data for annual growth.
The highest annual growth in the region was in St Helens, where property prices increased on average by 5.5%, to £185,000.
At the other end of the scale, properties in Tameside lost 4.6% of their value, giving an average price of £204,000.
Advertisement
Hide AdAdvertisement
Hide AdSouth Ribble
The average South Ribble house price in October was £214,554 – a 0.3% increase on September.
Over the month, the picture was different to that across the North West, where prices decreased 0.4%, and South Ribble was above the 0.7% drop for the UK as a whole.
Over the last year, the average sale price of property in South Ribble fell by £3,100 – putting the area 27th among the North West’s 35 local authorities with price data for annual growth.
Chorley
The average Chorley house price in October was £226,751 – a 2.1% decrease on September.
Advertisement
Hide AdAdvertisement
Hide AdOver the month, the picture was different to that across the North West, where prices decreased 0.4%, and Chorley was lower than the 0.7% drop for the UK as a whole.
Over the last year, the average sale price of property in Chorley fell by £5,400 – putting the area 30th among the North West’s 35 local authorities with price data for annual growth.
First steps on the property ladder
First-time buyers in Preston spent an average of £135,400 on their property – £2,700 more than a year ago, and £27,800 more than in October 2018.
By comparison, former owner-occupiers paid £192,700 on average in October – 42.3% more than first-time buyers.
Advertisement
Hide AdAdvertisement
Hide AdProperty types
Owners of detached houses saw the biggest rise in property prices in Preston in October – they increased 1.1%, to £316,260 on average. Over the last year, prices rose by 6.2%.
Among other types of property:
How do property prices in Preston compare?
Buyers paid 23.3% less than the average price in the North West (£216,000) in October for a property in Preston. Across the North West, property prices are low compared to those across the UK, where the average cost is £288,000.
The most expensive properties in the North West were in Trafford – £375,000 on average, and 2.3 times the price as in Preston. Trafford properties cost 3.3 times the price as homes in Burnley (£114,000 average), at the other end of the scale.
The highest property prices across the UK were in Kensington and Chelsea, at £1.4 million.
Comment Guidelines
National World encourages reader discussion on our stories. User feedback, insights and back-and-forth exchanges add a rich layer of context to reporting. Please review our Community Guidelines before commenting.